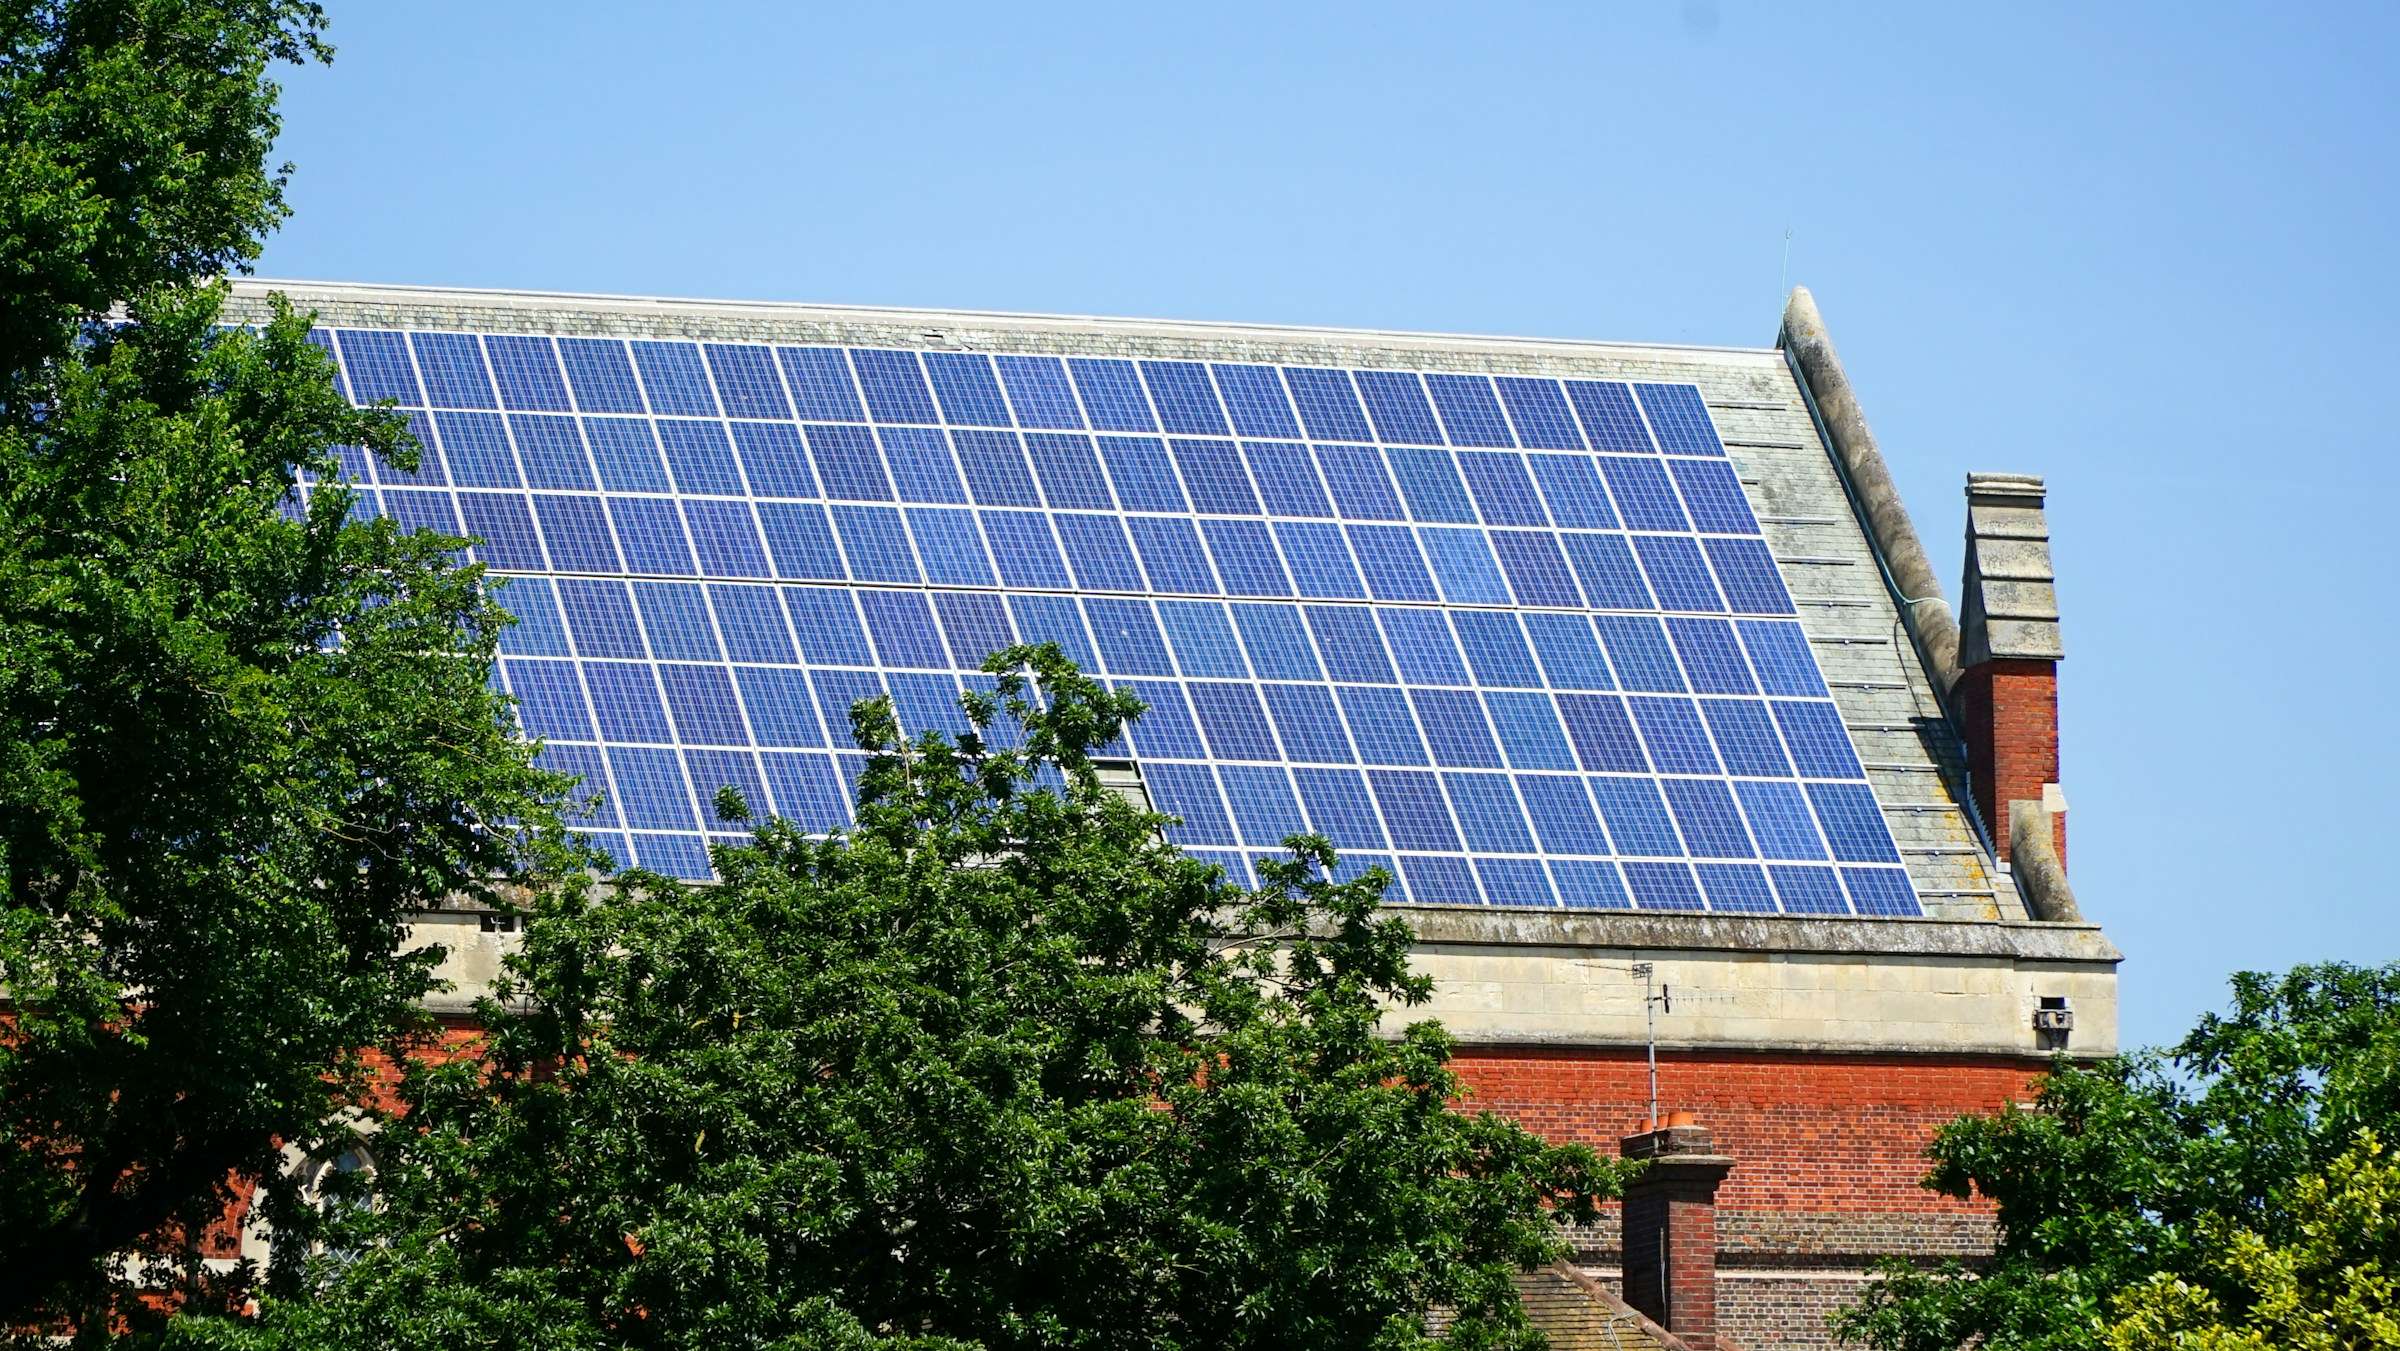
Kent and Medway had about 50,600 solar installations at the end of 2025, up from about 44,600 a year earlier. That is a rise of roughly 13% in twelve months. The figures below come from the government’s own statistics and cover every district.
The short version
- About 50,600 solar installations across Kent and Medway at the end of 2025.
- Roughly 6,000 more than at the end of 2024, a rise of about 13%.
- Maidstone has the most (5,715), then Canterbury (5,057) and Ashford (4,795).
- Ashford has the most per household: about 8.9 installations for every 100 homes.
- Thanet, Dartford and Folkestone and Hythe grew fastest, each by about 17% in a year.
- Across the county there are about 6.7 installations for every 100 households.
District by district
| District | Installations, end of 2025 | End of 2024 | Change | Per 100 households |
|---|---|---|---|---|
| Maidstone | 5,715 | 5,149 | +11% | 8.0 |
| Canterbury | 5,057 | 4,364 | +16% | 7.9 |
| Ashford | 4,795 | 4,354 | +10% | 8.9 |
| Medway | 4,157 | 3,748 | +11% | 3.7 |
| Swale | 3,997 | 3,461 | +15% | 6.6 |
| Folkestone and Hythe | 3,927 | 3,364 | +17% | 8.1 |
| Tonbridge and Malling | 3,652 | 3,158 | +16% | 6.8 |
| Tunbridge Wells | 3,629 | 3,240 | +12% | 7.5 |
| Dover | 3,435 | 2,965 | +16% | 6.8 |
| Thanet | 3,371 | 2,874 | +17% | 5.4 |
| Sevenoaks | 3,282 | 2,998 | +9% | 6.7 |
| Gravesham | 3,120 | 2,855 | +9% | 7.5 |
| Dartford | 2,482 | 2,116 | +17% | 5.4 |
| Kent and Medway | 50,619 | 44,646 | +13% | 6.7 |
How much power is that?
The same statistics put Kent and Medway’s installed solar capacity at about 953 megawatts. Capacity is spread very unevenly, because a few large solar farms outweigh thousands of rooftops:
| District | Installed capacity, end of 2025 |
|---|---|
| Swale | 448 MW |
| Canterbury | 123 MW |
| Thanet | 56 MW |
| Tunbridge Wells | 51 MW |
| Ashford | 50 MW |
| Dover | 40 MW |
| Folkestone and Hythe | 38 MW |
| Maidstone | 37 MW |
| Medway | 35 MW |
| Tonbridge and Malling | 30 MW |
| Sevenoaks | 17 MW |
| Dartford | 16 MW |
| Gravesham | 12 MW |
Swale alone holds nearly half of the county’s capacity with fewer than 4,000 installations, which suggests most of it sits in large ground-mounted farms. Maidstone has the most installations of any district but only 37 MW, which points to a great many ordinary rooftops.
What the figures do and don’t tell you
- They count installations, not panels. One home system and one 50-acre solar farm each count once.
- They include everything: homes, businesses, farms and solar farms. The statistics don’t split them, so the number of installations is only a rough guide to the number of solar homes.
- “Per 100 households” is our own sum: installations divided by the household estimate in the same file. Because the count includes business and farm systems, the true share of homes with solar is a little lower.
- Year-on-year changes are approximate. The government revises these figures as late registrations come in.
Where the figures come from
Department for Energy Security and Net Zero, Renewable electricity by local authority, 2014 to 2025, published September 2026 as part of its regional renewable statistics. We used the tables for solar photovoltaic sites and capacity by local authority at the end of 2024 and 2025, and added up the thirteen Kent and Medway districts ourselves.
You are welcome to quote these figures. A link back to this page is appreciated.
Why a cleaning business keeps count
We clean solar panels across East and Mid Kent, so we like to know where they are. More installations each year also means more panels that have had time for salt, lichen and bird mess to build up. If yours might be among them, our guide to whether solar panels need cleaning explains how to tell.